World Happiness Report Analysis
Introduction
The World Happiness Report ranks over 150 countries by how happy their citizens perceive themselves to be. This project explores trends from 2015–2019 to uncover which social, economic, and political factors are most closely associated with national happiness.
The goal was to support policy evaluation and regional recommendations by identifying the strongest contributors to happiness and understanding global disparities.
Data and Skills
Data Sources:
- World Happiness Reports (2015–2019)
- Over 780 rows of merged, multi-year data
- Key fields: GDP, Social Support, Life Expectancy, Freedom, Trust, Generosity, and Happiness Score
Skills and Tools Used:
- Python and Pandas: Data cleaning, merging, and correlation analysis
- Jupyter Notebook: Exploratory analysis and plotting
- Tableau: Geospatial and interactive dashboard
- Excel: Initial inspection and formatting
Project Planning
- Merge and clean data across five years
- Explore trends over time and by region
- Identify key happiness drivers using correlation and clustering
- Segment countries using unsupervised learning
- Share findings through dashboard and visual storytelling
Challenges and Solutions
| Challenge | Solution |
|---|---|
| Inconsistent column names and missing values | Standardized columns and used .fillna() and .dropna() |
| Difficulty comparing across years due to score scale shifts | Normalized values and created year-agnostic trends |
| Multicollinearity among factors | Used pairplots and scatter matrices to explore overlap |
| Tableau import failed initially | Cleaned dataset in Excel and exported as .csv |
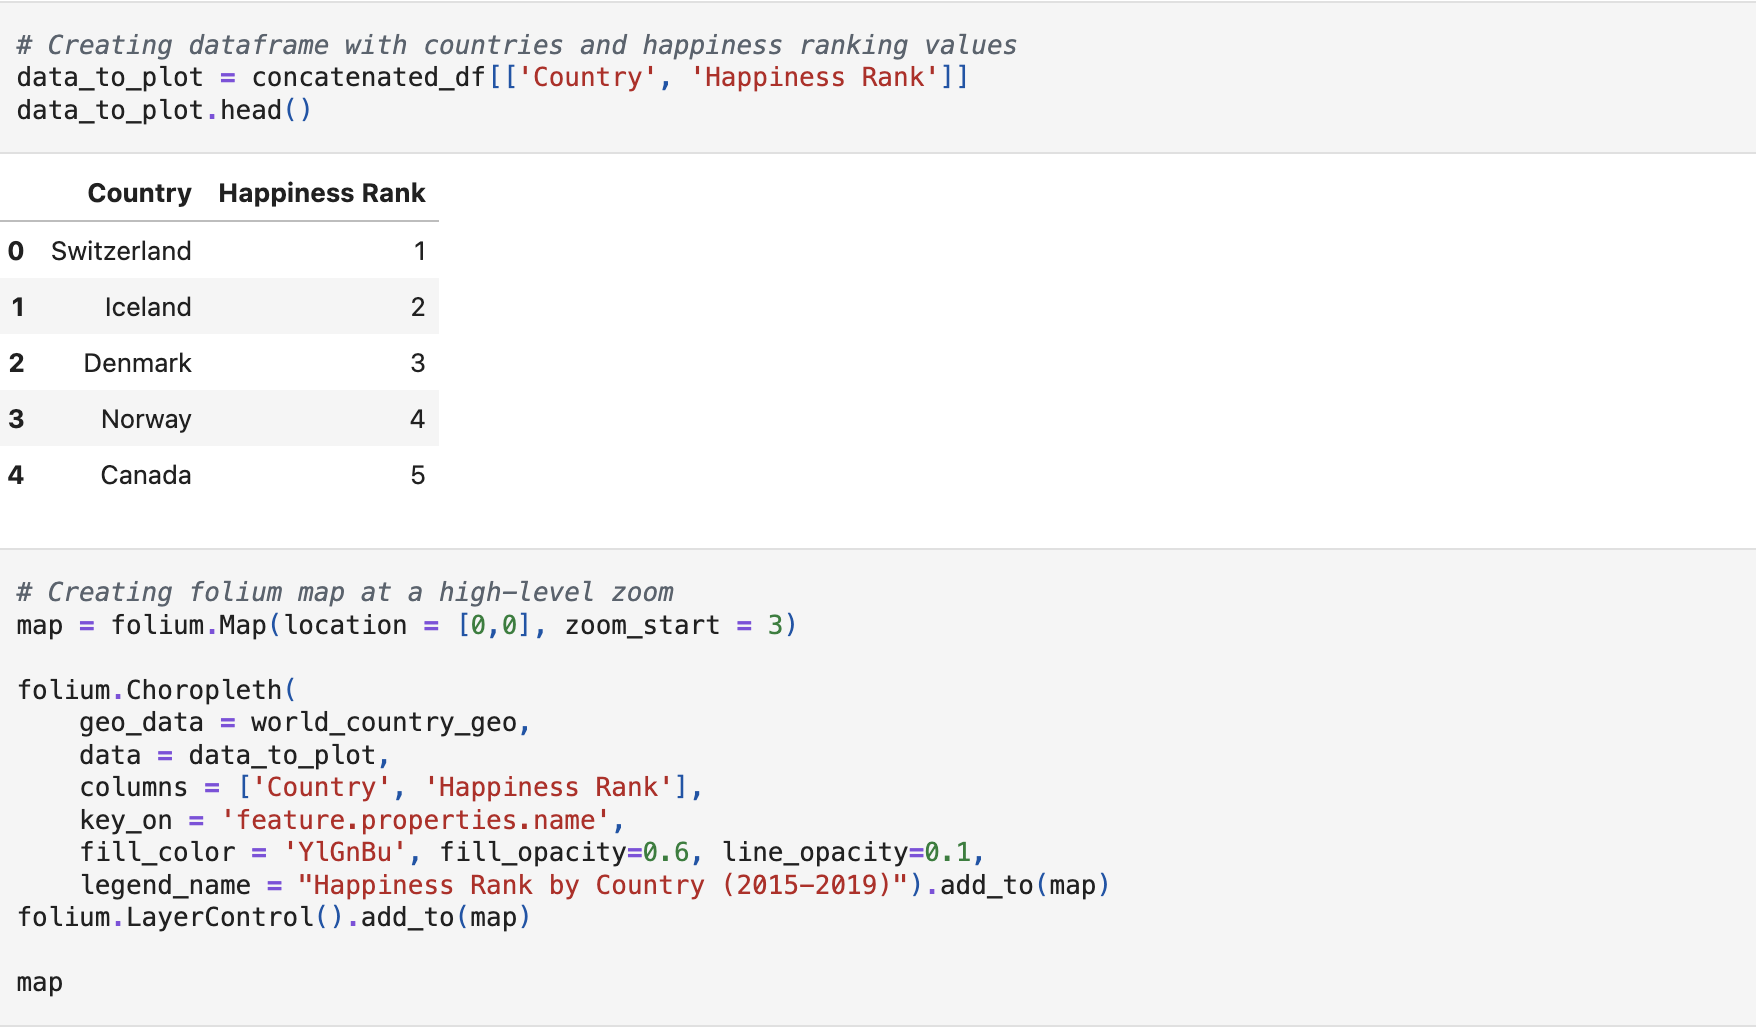
Geospatial Analysis
Key Insights:
- Nordic countries (Finland, Denmark, Norway) rank highest in happiness.
- Sub-Saharan Africa, parts of South Asia, and the Middle East rank lowest.
- The U.S. and Eastern Europe show moderate scores, reflecting mixed results.

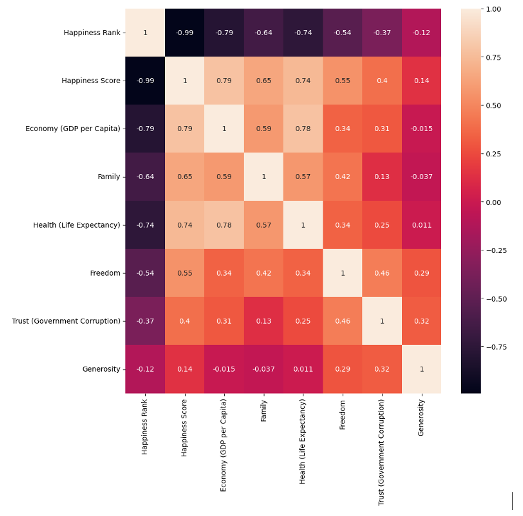
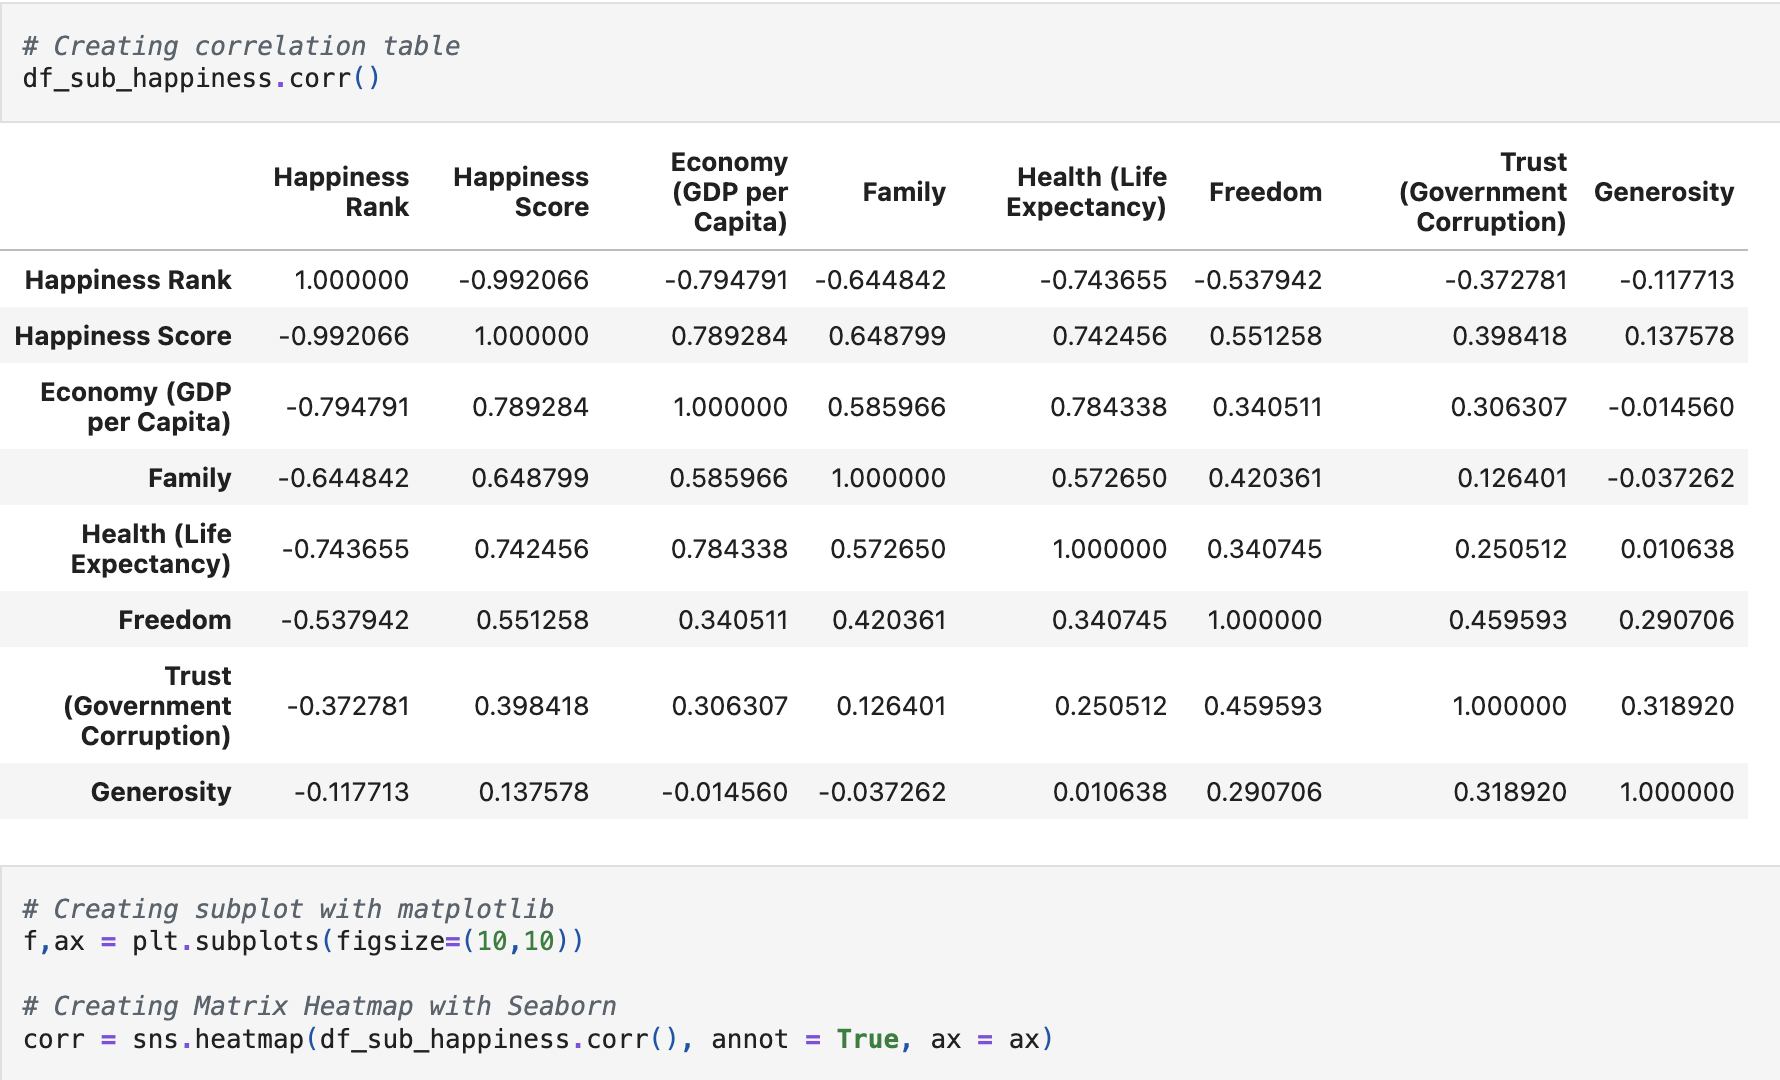
Correlation Heatmap
Key Insights:
- Happiness Score and Rank show a near-perfect negative correlation (-0.99).
- Economy (GDP), Family (support), and Health (life expectancy) show the strongest positive correlations with happiness.
- Freedom, Trust, and Generosity have weaker correlations, suggesting supporting rather than primary effects.
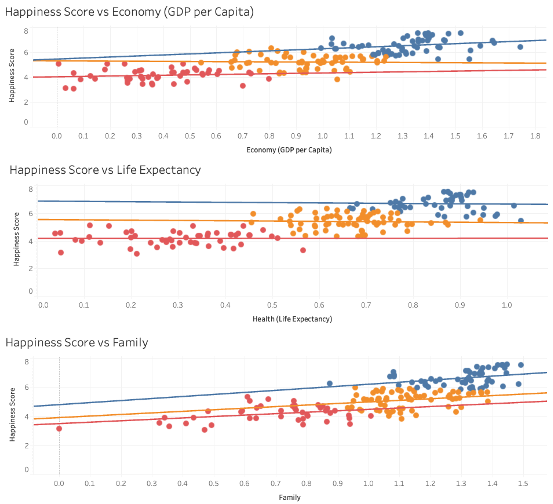
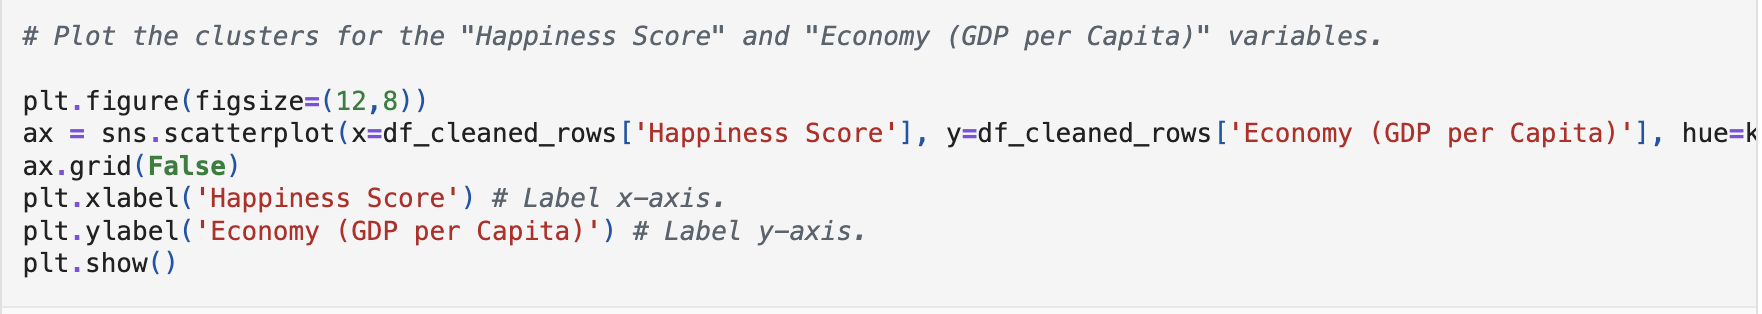
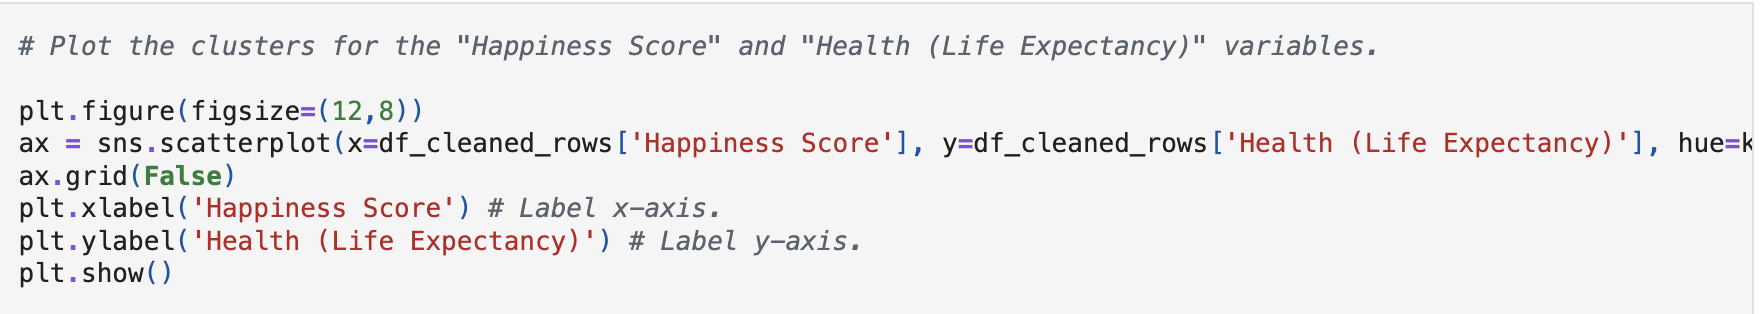
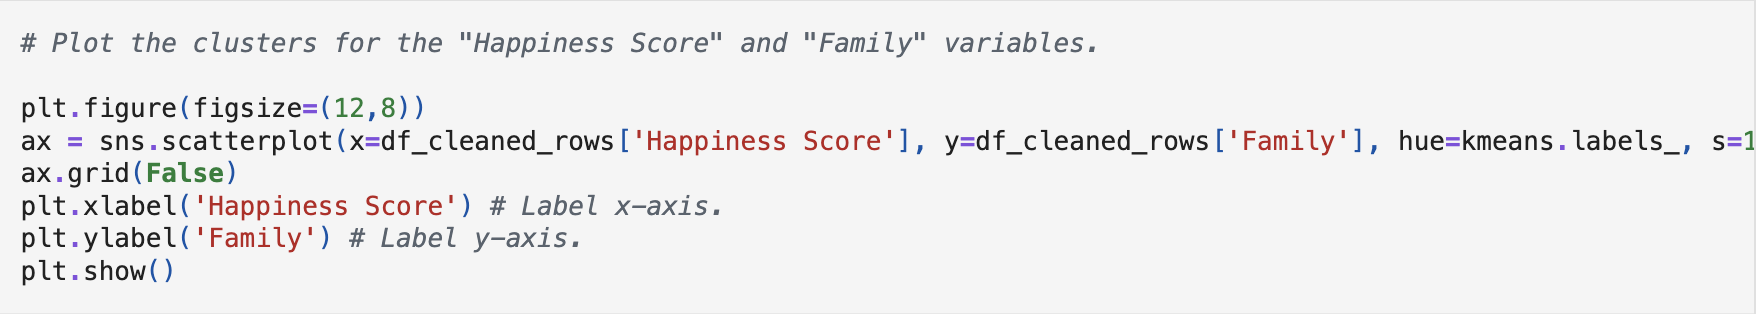
Cluster Analysis: Strong Factors
Key Factors:
- Economy (GDP per Capita)
- Health (Life Expectancy)
- Family (Social Support)
Key Insights:
- These factors had the highest correlation with happiness.
- Financial, physical, and emotional security are key to life satisfaction.
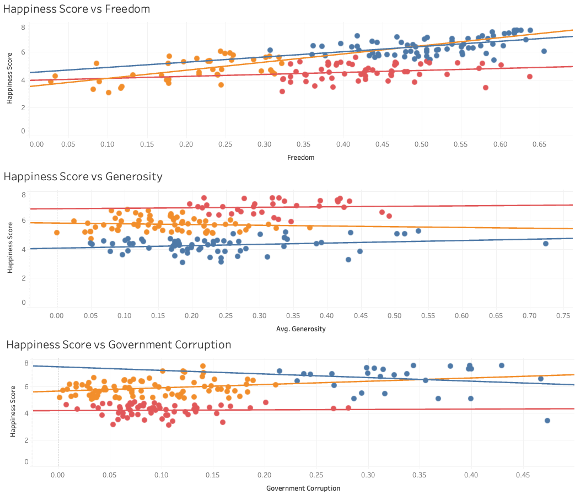
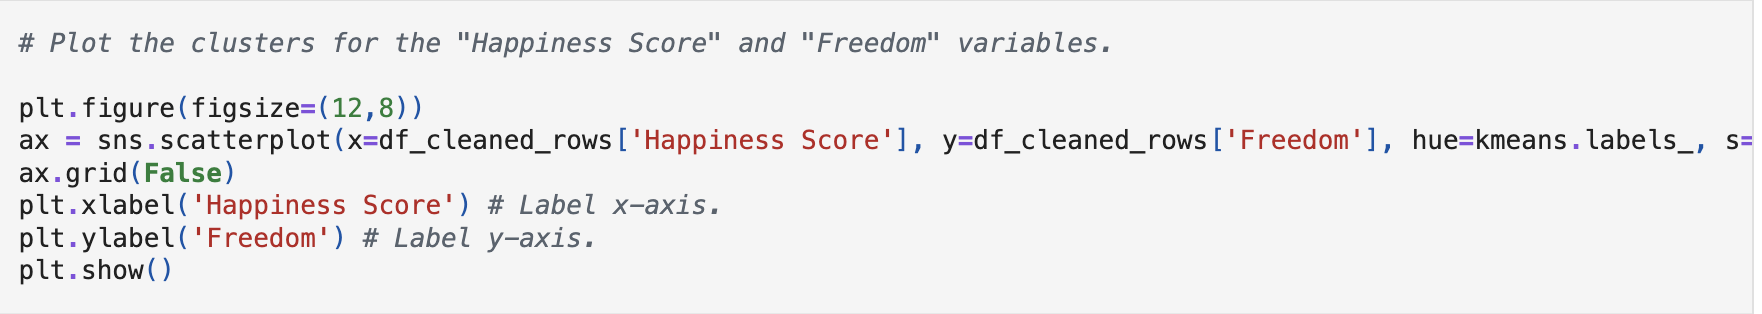
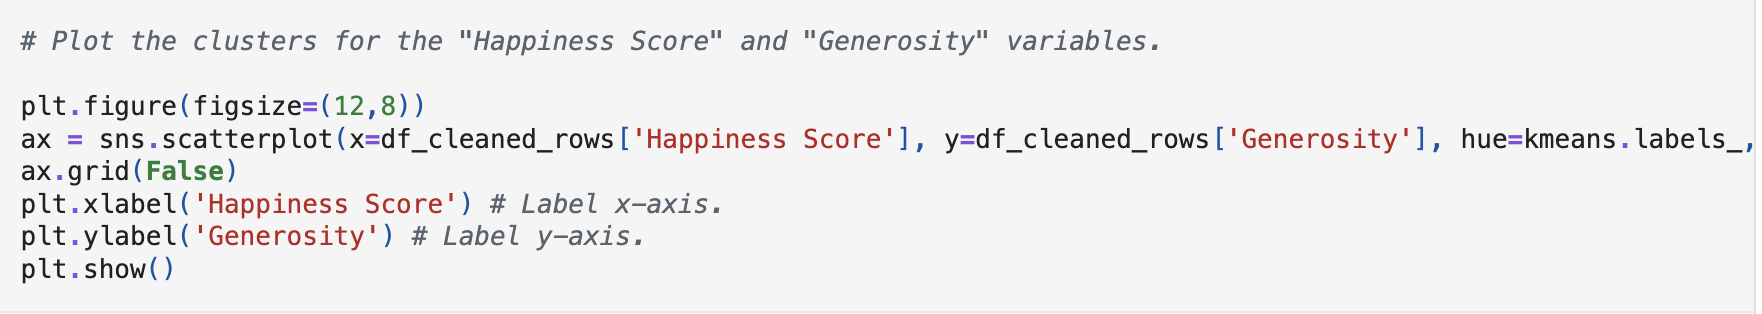
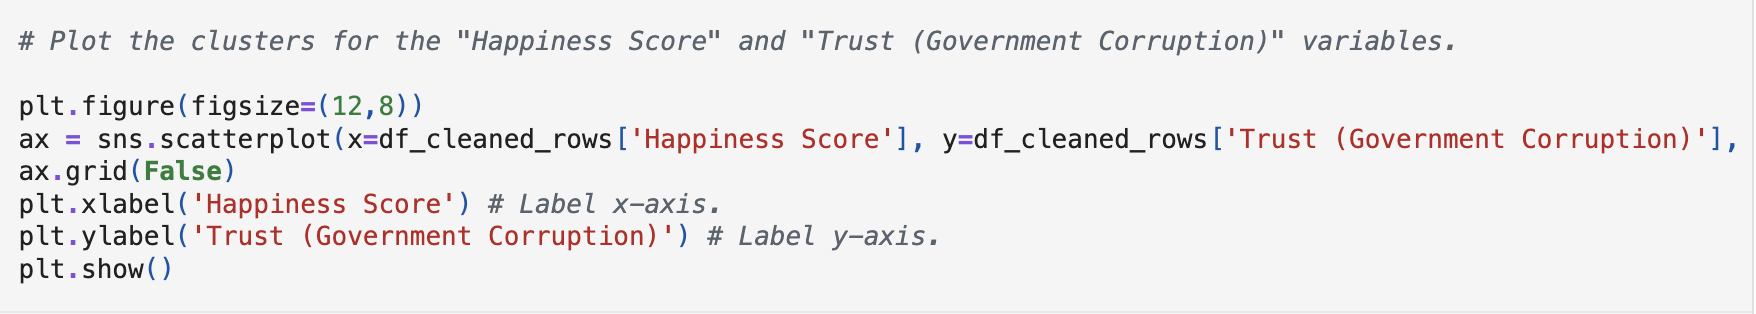
Cluster Analysis: Supporting Factors
Key Factors:
- Freedom
- Generosity
- Trust in Government
Key Insights:
- These factors may enhance well-being when paired with core factors.
- Their impact alone is not strong but may help improve scores in already-stable countries.
Interactive Tableau Report
Conclusions and Recommendations
Summary:
- Economy, Family, and Health are the top drivers of happiness.
- Freedom, Trust, and Generosity act as supporting contributors.
- Improving economic conditions, social services, and access to healthcare will raise national happiness.
Recommendations:
- Prioritize investments in healthcare and job growth.
- Improve community and family support systems.
- Use global leaders (e.g., Nordic countries) as models for policy-making.